With the rising threat of security breaches, data leaks, and cyberattacks, staying one step ahead is essential. This is where ELK Stack dashboards come into play, offering a powerful solution for monitoring, processing, and visualizing security-related data.
Understanding the ELK Stack
The ELK Stack is a powerful open-source solution for collecting, processing, and visualizing data. It comprises three core components: AWS Elasticsearch, Logstash, and Kibana. Each component plays a distinct role in the process:
- Elasticsearch: This high-performance full-text search engine excels at indexing and storing vast quantities of data. Plus, its swift and efficient search capabilities make it ideal for analyzing security-related data.
- Logstash: This is responsible for data collection, processing, and transmission. Logstash ingests data from diverse sources, parses it, enriches it, and sends it to Elasticsearch for storage. Essentially, Logstash’s flexibility makes it invaluable for handling various data formats.
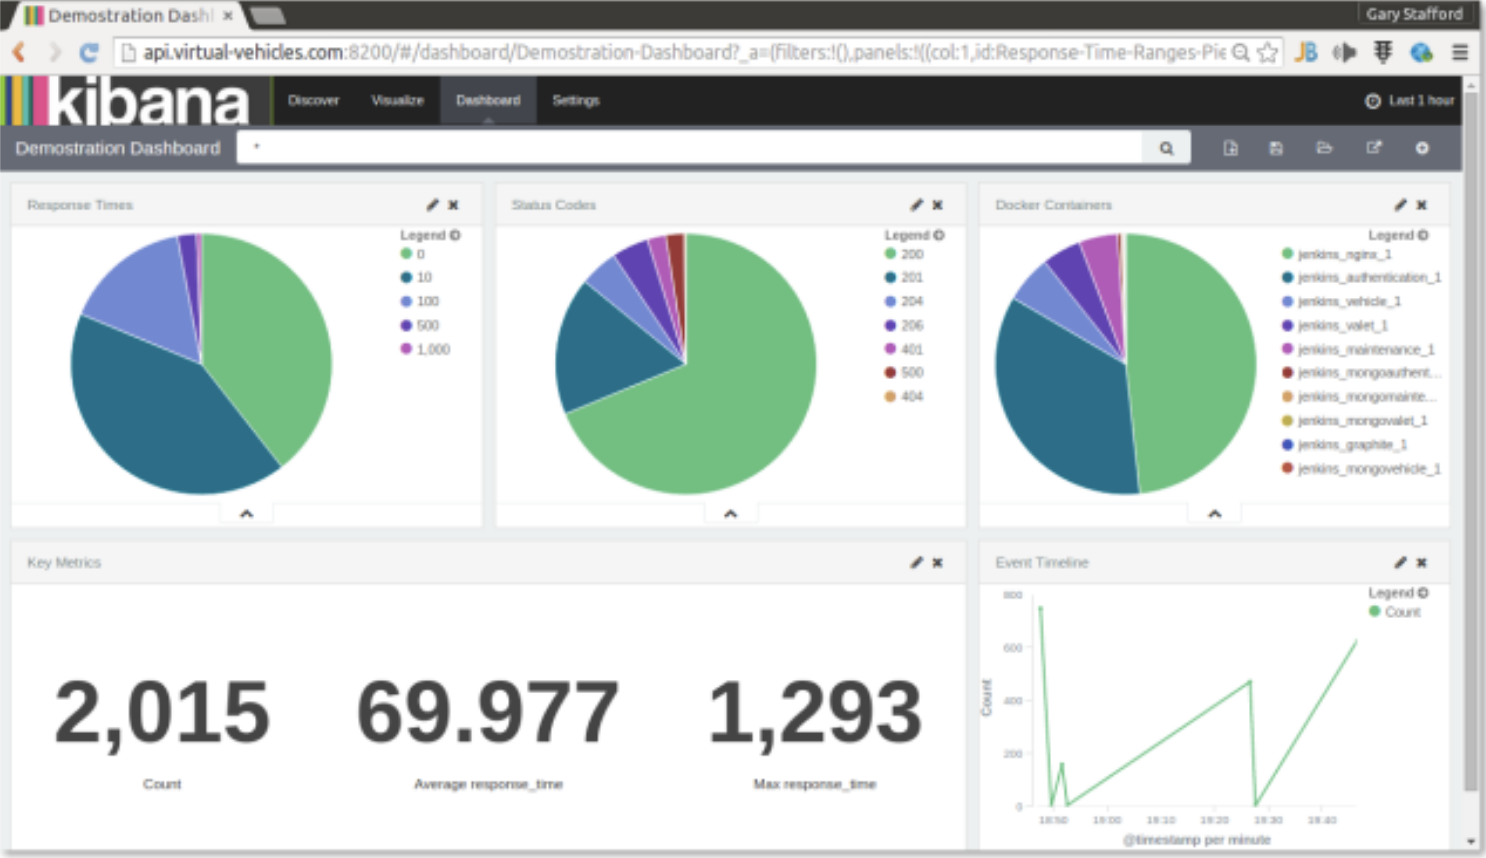
- Kibana: Serving as the visualization layer, Kibana provides an interactive interface for accessing data stored in Elasticsearch. It empowers users to create customized dashboards and generate visualizations. Ultimately, this aids in the identification of trends and anomalies in the data.

Why Choose ELK Stack for Security Monitoring?
The ELK Stack is popular for security monitoring for several key reasons. Firstly, its adaptability makes it suitable for diverse security-related events. It also accommodates various data sources and formats. Secondly, it excels in real-time monitoring, promptly identifying and responding to emerging security threats through immediate data analysis. Customization is another significant advantage, as it empowers users to create tailored dashboards and visualizations aligned with their specific security needs. Lastly, as an open-source solution, it offers strong capabilities without the high costs associated with proprietary security tools.
Key Metrics and Visualizations for Security Dashboards
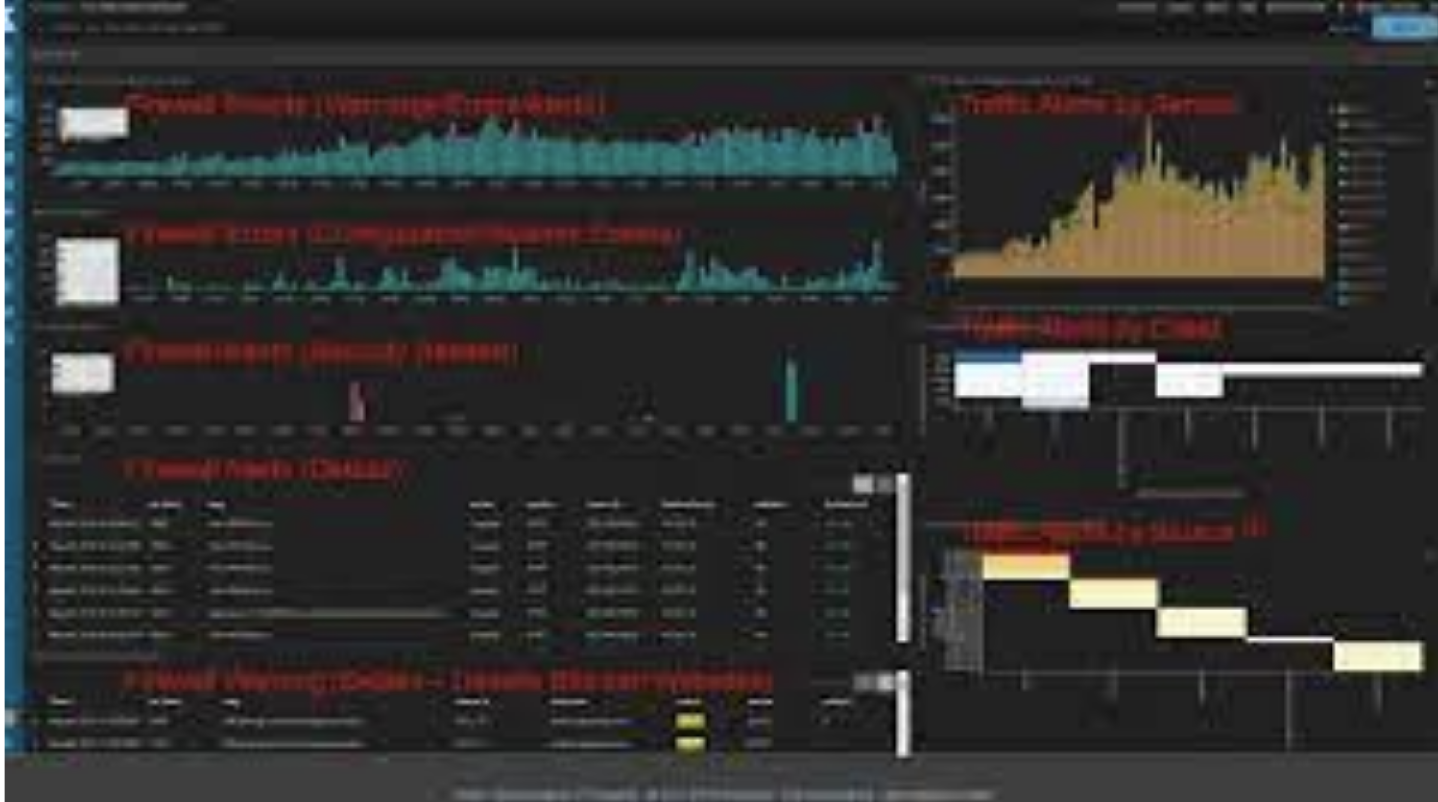
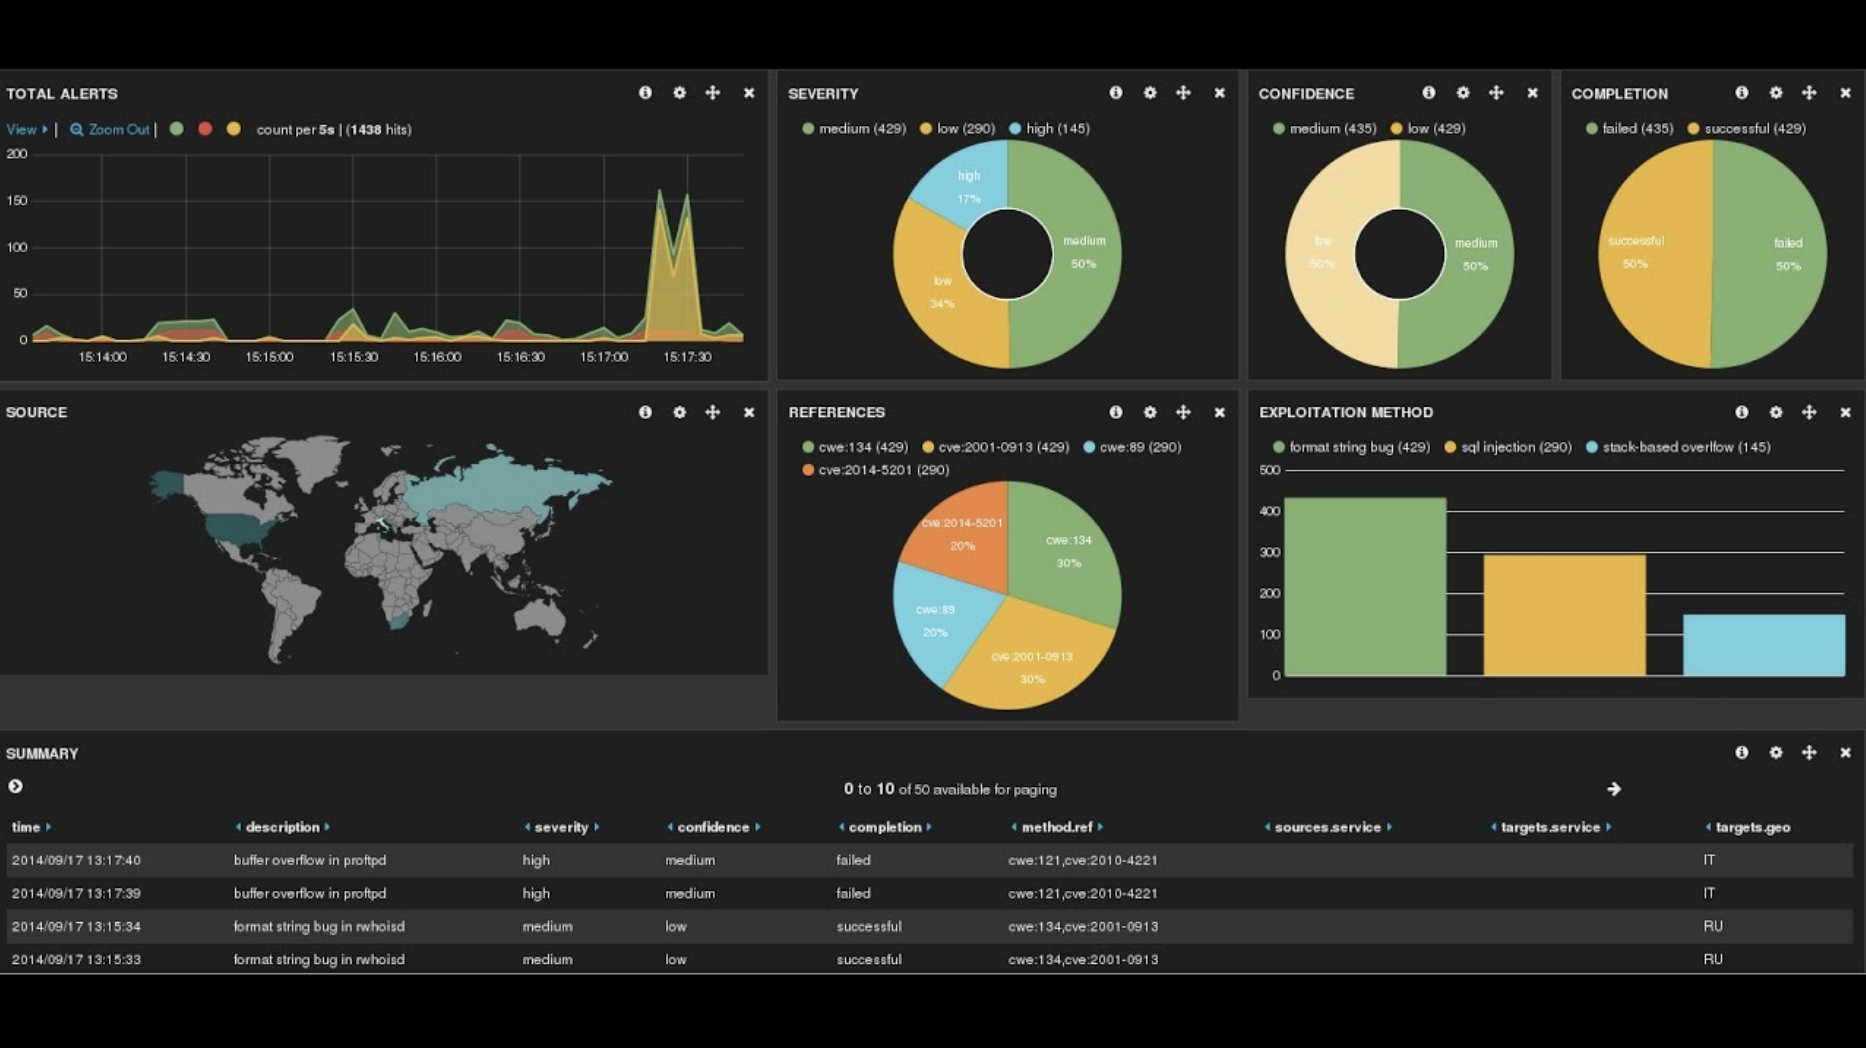
A key aspect of ELK Stack’s effectiveness in security monitoring lies in its ability to track pertinent security metrics and present them through intuitive visualizations. Here are some essential security metrics and visualizations that you should consider incorporating.

-
Alerting on Unusual Login Attempts
- Metric: Number of failed login attempts.
- Visualization: Line chart or bar chart.
- Importance: Sudden spikes in failed login attempts can indicate a security breach.
-
Geo-location Analysis with Heatmaps
- Metric: Countries accessing your website.
- Visualization: Heatmap.
- Importance: A heatmap can reveal unusual traffic patterns or suspicious activities, enabling proactive security responses.
-
Monitoring 404 Errors
- Metric: Number of 404 errors returned from your website.
- Visualization: Stacked bar chart.
- Importance: An increase in 404 errors may signify issues with your website or potential security threats.

Addressing Challenges in ELK Stack Setup and Maintenance
Implementing and maintaining the ELK Stack for security monitoring may present specific challenges. These challenges include:
-
Scalable Infrastructure
- Challenge: ELK Stack demands high-performance, scalable infrastructure, which not all organizations possess.
- Resolution: Consider cloud-based solutions or managed services offering scalability without substantial upfront investments.
-
Data Ingestion Complexity
- Challenge: Ingesting data from diverse sources may require networking expertise to build connectivity to the ELK Stack environment. Dealing with various data formats can be complex.
- Resolution: Leveraging data shippers, such as Beats, simplifies data ingestion. These lightweight agents collect and forward data to the ELK Stack. For organizations dealing with diverse data formats, Logstash, with its extensive filtering capabilities, streamlines the process.
-
Guidance on Key Metrics
- Challenge: Many organizations may lack the expertise to determine which security metrics and visualizations are most relevant to their security posture.
- Resolution: Seek guidance from managed service providers and security experts like our team for security monitoring. They can help organizations identify key metrics and design appropriate dashboards tailored to their needs.

Optimizing ELK Stack Dashboards for Security
To fully leverage ELK Stack dashboards for security, you should also follow best practices:
-
Utilize Filters
- Best Practice: Employ filters to reduce the amount of data that needs processing, focusing on specific data subsets and improving dashboard efficiency.
- Benefit: Implementing filters streamlines data analysis, enhancing dashboard performance and allowing security teams to concentrate on the most relevant information.
-
Leverage Caching
- Best Practice: Utilize caching mechanisms to improve query times. Caching stores frequently used data, reducing the time required to retrieve information.
- Benefit: Caching enhances dashboard responsiveness, enabling quick access to critical security data and faster responses to security incidents.
Conclusion
By implementing key security metrics in ELK Stack dashboards, you can bolster your security posture, swiftly detect and respond to threats, and protect critical assets. While challenges exist in setting up and maintaining the ELK Stack, they can be mitigated with the right strategies and support.
At SPK, we understand the critical importance of effective ELK Stack dashboards for visualizing security metrics. As a provider of managed services, we specialize in employing the ELK Stack to support our clients’ unique security requirements. Our extensive experience equips us to optimize the performance of ELK Stack dashboards and employ key security metrics effectively.
If you need support with your security or getting started with ELK Stack, contact our expert team for a no obligation discussion.


