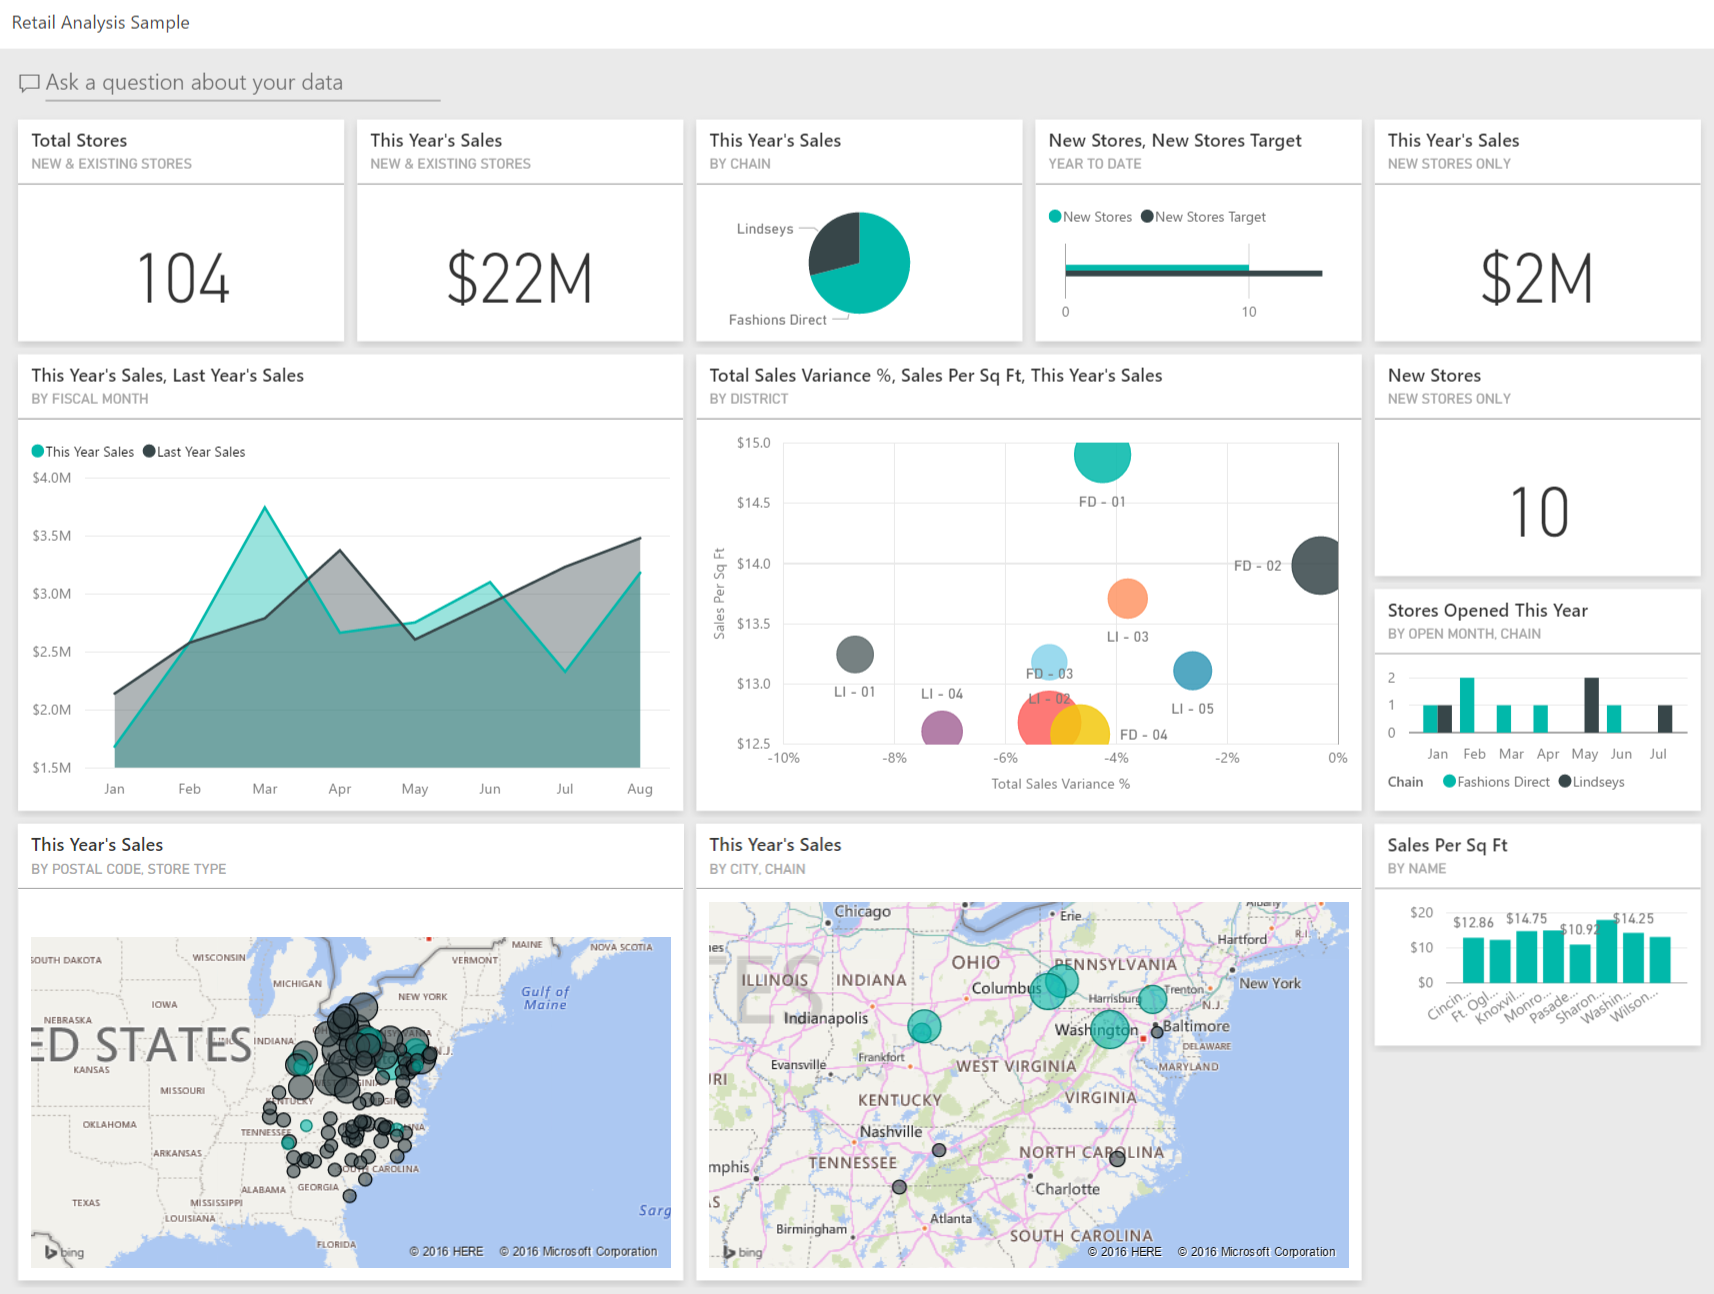
Power BI, Microsoft’s flagship business analytics service, offers comprehensive tools and capabilities for data analysis and sharing insights. This blog post provides a detailed introduction to Power BI. It covers its various components, how to set up the Power BI environment, and an overview of its basic functionalities. Whether you’re a business analyst, data professional, or just someone interested in making sense of data, this guide will help you get started with Power BI.
Overview of Power BI
Power BI is a suite of business analytics tools that enables you to connect to a wide range of data sources. It simplifies data prep and drives ad hoc analysis, allowing users to create interactive reports, dashboards, and visualizations. These items are shareable across your organization and can be embedded in your app or website.

Power BI consists of several components, each serving a specific function in the business intelligence ecosystem.
Power BI Desktop
Desktop is a free application you install on your local computer that lets you connect to, transform, and visualize your data. Power BI Desktop’s rich, drag-and-drop canvas and extensive library of interactive visualizations allows you to develop deep, actionable insights for a broad range of scenarios. While Power BI Desktop allows you to build reports and visualizations, you can’t share reports with others unless you have some of the components listed below.
Power BI Service
Also known as PowerBI.com, Power BI Service is an online reporting service provided by Microsoft. It allows you to publish your Power BI reports and dashboards, schedule automated data refreshes, and create dashboards that keep your data and reports up to date. Moreover, it facilitates collaboration among team members by sharing insights, visualizations, and apps.
Power BI Mobile Apps
Power BI Mobile Apps are mobile applications available on Windows, iOS, and Android devices, They enable you to view and interact with your Power BI or SQL Server 2016 Reporting Services content on the go.
Power BI Gateway
Gateways sync external data in and out of Power BI. In essence, they enable you to query large datasets and ensure your reports and dashboards are always up to date.
Power BI Embedded
Embedded is a Power BI service that lets developers embed stunning, fully interactive reports and dashboards into customer-facing apps. It eliminates the time and expense of building them from the ground up.
Setting Up the Power BI Environment
To get started with Power BI, you’ll first need to set up your environment. Here’s how you can do it:
-
- Go to the Power BI website and download the Power BI Desktop application. It’s available for free and is your primary tool for building Power BI reports.
- You can register for the Power BI service at PowerBI.com. If you have an existing Microsoft account or Microsoft 365 subscription, you can use that to sign in.
- Download the Power BI app on your mobile device for accessing reports on the go.
- If your data sources are on-premises, you will need to set up a gateway to refresh your datasets in Power BI automatically.
- In the event these actions are not something you can do, contact SPK’s team of experts. We can provide you a Microsoft 365 subscription and assist with the infrastructure setup of your Power BI environment.
Basics of Power BI Interface and Functionalities
Power BI Desktop’s interface is intuitive and designed to make the process of data exploration, visualization, and report generation as straightforward as possible. Here’s a brief guide to understanding the basic functionalities:
- Ribbon: The ribbon at the top contains tools for adding data sources, creating new visualizations, and modifying existing ones.
- Report View / Data View / Model View: These views in Power BI Desktop allow you to switch between visual report editing, viewing table data, and viewing data models respectively.
- Fields Pane: The fields pane lists all the tables and fields within your dataset and is where you drag fields onto your report canvas.
- Visualizations Pane: This pane allows you to change the type of visualization you are working with, adjust properties of visualizations, and control page-level filters.
- Filters Pane: The filters pane offers report-level, page-level, and visualization-level filters to control which data is displayed in the visualizations
Getting Started with Power BI
Getting started with Power BI can transform the way you handle data analysis and decision-making within your organization. Familiarizing yourself with Power BI Desktop, the Power BI Service, and the suite’s other components, allows you to unlock powerful insights from your data. Setting up your Power BI environment properly and mastering the basic concepts and functionalities are crucial first steps. If your team doesn’t have the expertise for this, SPK can assist. As you become more comfortable with Power BI’s interface and capabilities, you’ll find that creating dynamic reports and interactive dashboards is not only intuitive but also incredibly impactful. Embrace the journey into data visualization with Power BI, and empower your team to make informed, data-driven decisions.


