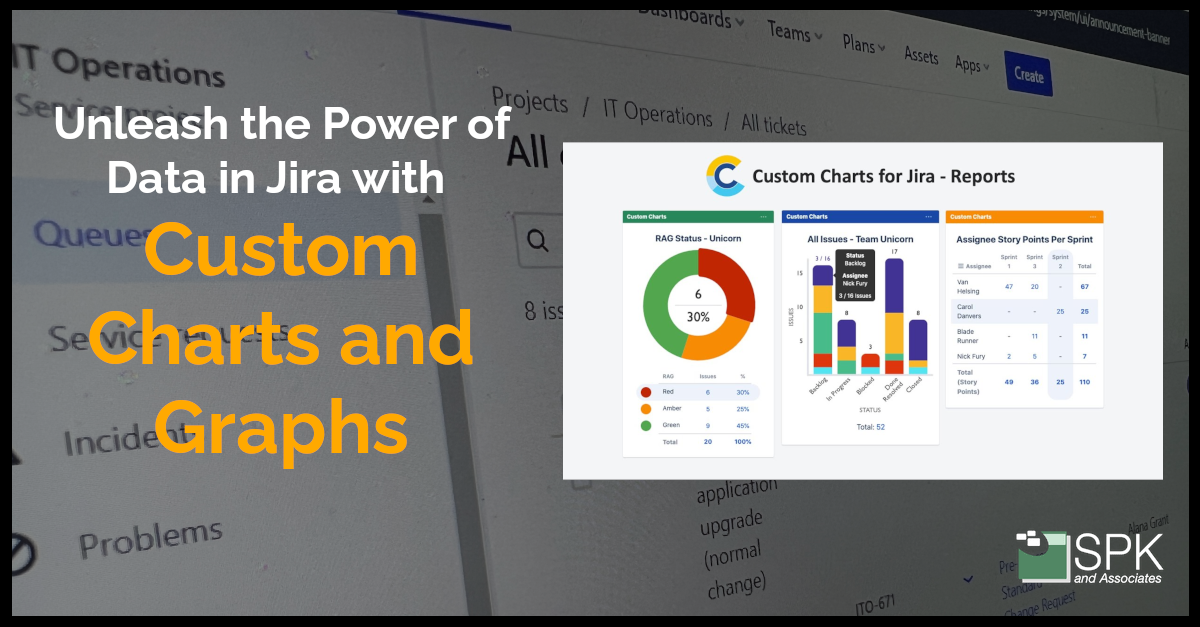
When it comes to project management and collaboration, understanding your data is key to making informed decisions. Jira is a fantastic option for project managers to keep on track. And, it becomes even more potent with the integration of the Custom Charts plugin by Tempo Software teams to visualize and analyze their data effortlessly. Since Tempo Software’s acquisition of Old Street Solutions, makers of Custom Charts, they have continued to evolve the product. Let’s dive into how Custom Charts will revolutionize your Jira experience.
Why You Should Use The Custom Charts Plugin By Tempo Software
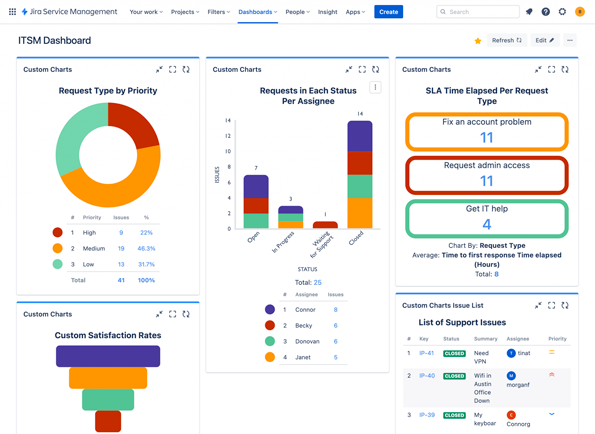
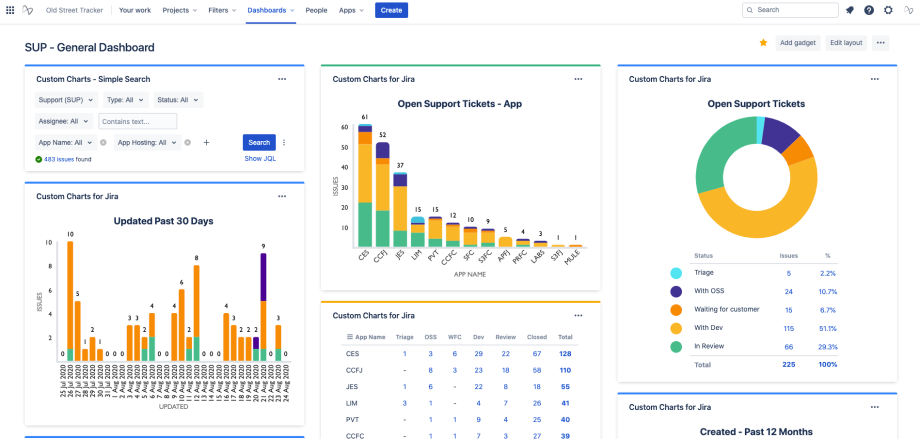
Imagine having the ability to build charts and dashboards tailored to the unique needs of your team, whether they’re handling agile projects, IT service management, marketing campaigns, or HR tasks. With Custom Charts, you’re not limited by the type of project or team you manage. You can:
- Track sprint progress, velocity and time in status
- SLA success
- Assignee workloads and blockers
- Customer satisfaction
- Cumulative spend
- And more

Easily Display the Data You Want
Custom Charts simplifies the reporting process with its user-friendly interface. No coding or Jira Query Language (JQL) expertise is required. It’s as easy as drag-and-drop. Want to change colors, labels, or chart types? No problem. You have the flexibility to show/hide, combine, and dynamically filter data. Calculate sums or averages effortlessly, and even add a second variable to chart in 2D. Furthermore, the inclusion of chart templates provides a head start for those new to data visualization.
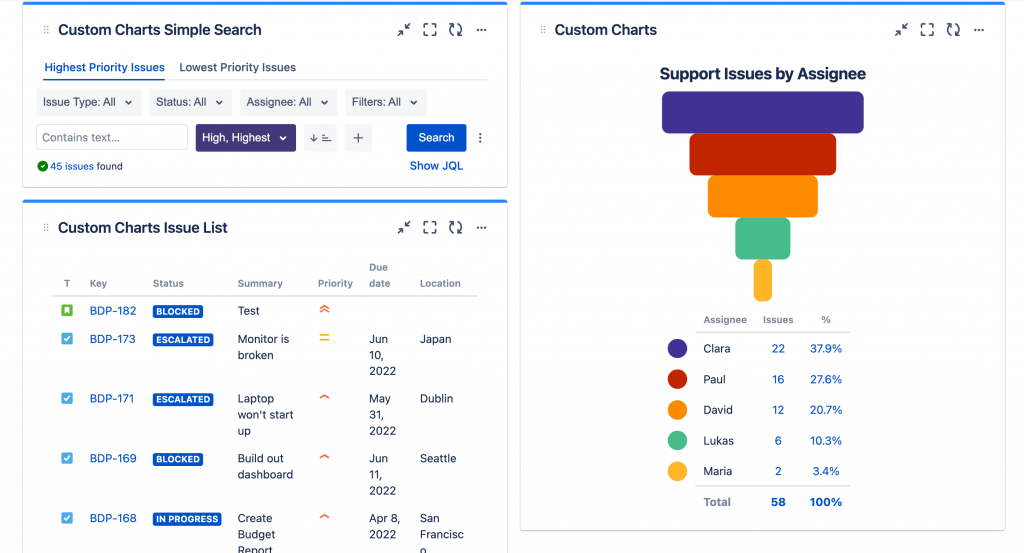
The Issue List Gadget: Quick Filters
This feature is available if you are using Jira and Confluence. With this gadget, you can quickly dive into the Jira data displayed in the Issue List gadget. It saves report readers time given you don’t need to create a separate report to understand the data. Furthermore, you can also use JQL to create a custom quick filter in the Issue List gadget. Check out how to configure this gadget in the video.
Enterprise-Level Reporting
The bigger picture matters. That’s why Custom Charts lets you see how work is progressing across all corners of your organization. Additionally, its charts and dashboards can span multiple projects and teams, providing a comprehensive view of your operations. That means you can visualize progress on custom issue hierarchies made with Structure for Jira. Plus, you can quickly identify blockers with Timesheets and time-in-status reports. Moreover, Custom Charts doesn’t operate in isolation—it integrates seamlessly with popular third-party apps and Jira Premium features, such as ScriptRunner, Xray, Assets, and Advanced Roadmaps for Jira.
Share Dashboards Outside Jira
Transparency and collaboration are crucial in any project. That’s why Custom Charts enables you to export reports. Additionally, you can create read-only charts with stakeholders and collaborators outside your Jira instance. The Shared Dashboards gadget allows customers in the Jira Service Management portal to see how work is progressing on their requests. Additionally, the integration with Confluence allows for the display of fully interactive and customizable Jira dashboard reports on Confluence pages, fostering better collaboration between development, IT, and business teams.
Conclusion: Unleash Your Team’s Potential with Custom Charts
In a world inundated with data, making sense of quantity drives quality. Custom Charts and Graphs for Jira provide the tools needed to not only visualize your data but to make it accessible, understandable, and actionable. So, whether you’re a seasoned Jira administrator or a team member navigating the intricacies of project management, Custom Charts puts the power of data in your hands.
SPK and Associates are Tempo Software and Atlassian partners. So, if you have questions on how to get the most out of your Jira instance, or how to integrate with Custom Charts, our team can help. Contact us here with any questions.


