

Introduction
Hello, everyone, and welcome back to another SPK & Associates Vlog. My name is Michael Roberts, and today I am joined by Julia Wester, CEO of 55 Degrees, who is an Atlassian Marketplace Partner.
So, Julia, welcome, and please introduce yourself.
Hi. As Michael said, I’m Julia Wester. I’m the CEO of a company called 55 Degrees, and we build apps that help people understand how they work, answer when it will be done, and improve and remove the frustrations around getting work done.
One fun fact about me is that I used to be a music teacher, or I trained to be a music teacher for kindergarteners and elementary school folks, but then I decided, you know, I’d rather go into this coding thing and move on.
I love it. I love it. And I love the fact that you’re now teaching people how to be more predictable, right?
So I’m still using my degree in one way or another.
Yeah, yeah, yeah.
That’s adult education.
Absolutely.
And it’s very valuable, very valuable.
Why Agile Teams Struggle with Predictability
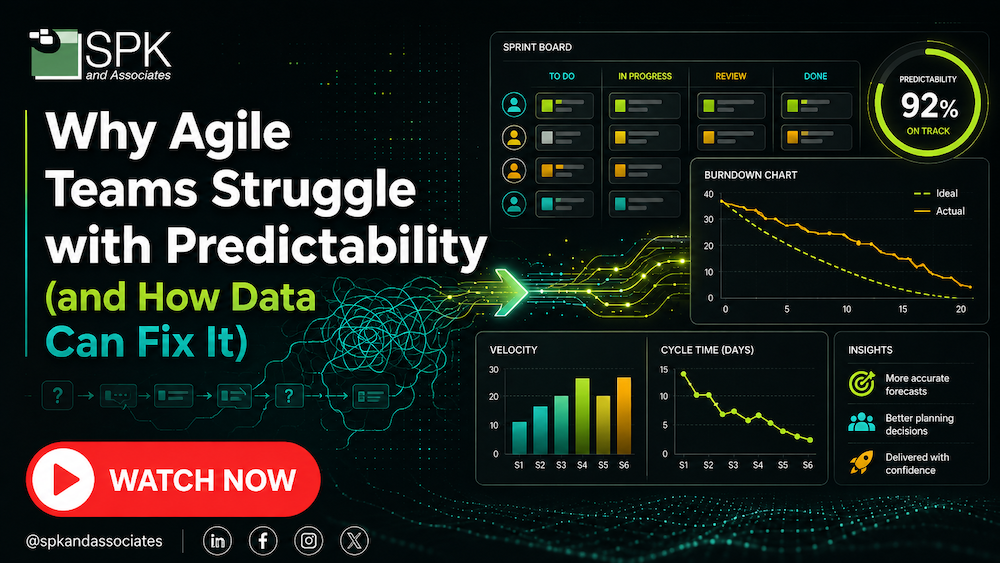
So, Julia, our topic today is why Agile teams struggle with predictability and how data can fix it.
Obviously, we’re going to talk about how traditional approaches, story pointing, and then there are also companies that I’ve been in and seen that have had that gut-feel estimate, and those things often fall short.
There are ways that you can gather data and use data, especially inside of Jira and your app, that can actually help teams be better at forecasting, be more confident in understanding when things are going to get completed, identify risks earlier, which is a really big thing, and then hopefully have better conversations with stakeholders.
Why Teams Struggle with Accurate Depiction of Delivery Dates
So, the first thing I want to understand a little bit more: these teams that are relying on story points or gut feelings for planning, why do so many of those organizations still struggle with accurate depiction of delivery dates?
There’s a lot there in that question, but there are some common threads.
Regardless of what kind of prediction or estimation that you’re trying to do, generally, I think the root of the problem is that there are way more factors involved in how long it takes to get work done, whether it’s a single item or a group of work together.
There are way more factors than we can even begin to model.
Why Story Points Fall Short
So, what you see a lot of times is either we pick one data point that might have something to do with the work. So let’s use story points.
There are a couple of things about that. Story points were always meant to be about complexity, and I don’t know about you, but I used to be a developer, I used to be a dev manager, and we spent so much of our time trying to convince people that story points were not about time.
Yet then we turn around and try to use them to forecast the time it will take, and it just doesn’t really make sense. But you use the tool that you have, right?
But even if that were indicative of the time it takes, because let’s say complexity is one of the factors in how long it will take to get work done, it’s by far not the only factor and, according to the data that we’ve seen, not really the biggest determining factor of how long it will take to get done.
Outside Factors
If you think about what influences how long it takes any one of us to do a piece of work, we have things that we’re dependent on other people for.
We come to the office with a certain attitude that day. Our life is happening. Other people are sick. We get interruptions. Priorities change. We have meetings.
All of these different things are happening, and none of those were about the piece of work itself.
But any one of those can be much more impactful than the complexity of that piece of work on how long it’s going to take you to get things done.
A lot of the decisions that we make about how we work influence how long it’s going to take to get any one individual thing done.
But let’s say that we could think about multiple factors and we could start building this model.
I think you go down sort of a slippery slope because you’re going to get to the point where you’re never going to be able to model everything, and even if you could identify all the factors, you’re never going to get the right balance of the impact of any one of those factors on how long it’s going to take you to get your work done.
So, by the time you get to that realization, you’ve spent so much time doing everything but the work, right? And you’re still wrong.
Let Your Historical Data Become the Model
So where we are right now, when people generally come to our product, is they’re in that area where they’ve realized, “We’re doing all of this stuff, we’re working really hard, and we still don’t have any answers, or the answers that we have are wrong so often that they might as well not be useful. It’s making us look bad.”
So, when people come to us, one of the things that I’m happy to be able to hopefully help them see is that your data can come to your rescue.
Forget trying to predict what factors are going to happen to you.
Instead, flip the script and look at what you’ve been able to do, how fast you’ve been able to get work done in the past, and how much work you’ve been able to do while all this stuff was happening to you.
So your data becomes the model.
You don’t have to anymore figure out all those factors and the rates at which they impact.
Just start looking at, “When my situation is like it is, what can we do?” Then use that answer as how you forecast going forward in the future.
Some people think that’s too easy, and some people point out that things can always happen in the future that haven’t happened in the past, or if conditions change, how do we account for that using our data?
Those are all valid questions, but there are much easier questions to deal with than the fundamental flaws in the more traditional methods that we’re trying to use.
Using a Cycle Time Scatter Plot for Story Points
Actually, I found the best way to talk about story points and how they don’t really map to time through one of our customers.
They came to us and said, “We use your cycle time scatter plot.”
What that is is a chart where every item that you finish is plotted on a chart based on what day it finished and how many days it took from start to finish.
So you get, like, “This one finished on this day. Seven days it took from when we started to when we finished.” So you see all these dots.
Then they said, “Well, you can color the dots by any data point.”
So they colored them by story points. They pulled in the story points field for every item and said, “Let’s apply colors based on story point values.”
So, you have the one, the three, the five, the seven, whatever. I’m sorry if I got one of those wrong. But you get the whole Fibonacci sequence, right?
What you would expect, if there was a high correlation of story points to the time it takes to deliver, then you would see that on the chart.
You would see roughly bands of color. You’d see the ones, the threes, the fives, etc.
We have never, ever seen that. Ever.
What The Scatter Plot Reveals
What we’ve seen is just, like, there’s no pattern at all.
Which doesn’t say that story points aren’t valuable, but it tells me pretty clearly that it is not a tool for forecasting at all.
So it’s just really interesting. I don’t have to preach it to people. I can just say, “Well, let’s pull up your data, and let’s see if that is valid.”
Exactly.
If that has any correlation at all. And you know what? If it does, great.
But if it does, then you don’t have to do the story pointing just to get that answer, because you can just look at your data and get the same answer.
It’s all about getting more accurate answers with less effort.
Using Actionable Agile Analytics With Jira Data
I love this.
The reality is, you always bucket developers. Many developers are very creative people, and very creative people aren’t, especially when you’re doing poker planning and story pointing, they’re not good at… they’re trying to solution for the thing, and to even give a number is difficult.
So I love the data component.
You’ve built this solution around addressing these problems around data.
So how does your product, which is Actionable Agile Analytics, use the Jira data to help those teams forecast more reliably and identify those potential risks earlier in that process?
Yeah, so I think this is pretty cool, right?
Instead of trying to spend time filling in this model that these different models are trying to build to get a forecast, really, all I want people to have to do is focus on doing the work as normal, moving the work through their Jira workflows as the stuff is happening.
Sometimes people don’t do that normally, but if we can focus on keeping the work reflective of its actual status in Jira, then Jira is going to grab all of the data you need to forecast.
So users, people, they just have to do their work. They have to update the status.
Then, when people come into our app, we basically say, “What data do you want to load? Which board? Which filter? Which project?” Whatever.
There’s a little setup of understanding how the work moves through that workflow.
And then once we see that, we calculate some basic flow metrics.
The Four Core Flow Metrics
So there is cycle time: how long does it take to complete a piece of work?
Throughput: how much work do you deliver in a given period of time?
It’s a bit like velocity, but instead of with story points, it’s with actual finished…
Real data, right?
Exactly.
This is the work you did.
We’re actually trying to answer.
Work in progress: how many actual things are in progress right now?
And of all those things that are still in progress, how long has it been since you started?
So, work item age.
That right there is the unsung hero of improving your situation.
So anyway, with those four flow metrics, we can answer all your questions about how long it takes to finish a piece of work and how much work we can finish in a given period of time.
So, your fixed-date questions, fixed-scope questions: we have to finish this set of work. When can it be delivered?
And then a lot of other things about how is it going as we do this work? Where do things pile up? Are we taking on more and more work and not finishing it?
Using Data to Improve the Process, Not Just Create Charts
One of the things that people have said about our tool is that it looks like a bunch of charts, because it is.
But the point isn’t to just get data. It’s to improve the process.
We’re improving your process through seeing information that was hard to see before and having conversations as early as possible.
So what we’re trying to do is give you a better way to see data so you can have earlier conversations and do the things that you need to do to see different answers in your data.
The values that people tend to see right away are an understanding of, as soon as you get your data in, you can see pretty much at a glance: 80% of the time, it takes this many days or less to finish a piece of work.
How much work can we get done in 30 days? How much work is in progress right now? That kind of stuff.
Also, how much has started versus how much do we finish in a given month, and things like that.
So that gives you a level of understanding of what you’re capable of right now.
When Your Actual Delivery Data Doesn’t Match Your Sprint
The thing is that a lot of times, people don’t like that answer.
So let’s say you are working in two-week sprints, but 85% of the time it takes you 35 days to deliver a piece of work.
That’s the actual situation.
When I used to do more consulting, I had that exact example with someone.
Two-week sprints, they think it’s going great, right? Thirty-five days most of the time to deliver a piece of work.
That doesn’t really go together, so we see right away there’s a disconnect.
So that’s the first thing.
Checking Your Work In Progress
What if you don’t like that answer?
The only way that you can improve how long it takes you to get work done is to better manage it while it’s in progress.
So, we spend a lot of time helping people see how old their work in progress is.
Give them signals so that they can ask more questions and control things so that they don’t start more and more, and then everything takes longer and longer and longer.
By paying attention to that work in progress and how old it is, which is really difficult to see, there’s no native Jira report to do that.
There’s nothing.
It’s like the thing you need to know the most that no one is showing you.
By seeing that, our dev team pulls the work item age chart up in their dailies, and they make sure that that’s something they’re considering as they make plans for how they’re going to do their work that day.
When you start to see that kind of information, you make better decisions.
Then you start to see that number, like, 85% of the time it takes 35 days or less to finish work, start to move down to maybe 32 days, 28, etc., until you get down to where you want to be.
And if you’re in a sprint, one thing when I was teaching adding these flow concepts to Scrum teams is: what if you could start a piece of work halfway through your sprint and still have a high chance to finish it within that same sprint?
Why Small Workflow Problems Have a Massive Impact
There are things that people can do to become more predictable, to have better capabilities of finishing work faster. They just need the tools to have the right conversations at the right time.
Absolutely.
Yeah, there’s so much more I could say, but we’ll go with that for right now.
Look, much like you, I’ve been in the world of software development, and all the things you’re saying are hearkening back to all the problems that I ran into.
Like, “Oh, what do you mean you don’t know how to estimate?” Or, “What do you mean this has been sitting in progress for three weeks or four weeks, or whatever, and nobody’s looked at it?”
Those types of things are very small, but they are massively impactful, especially being able to answer the “when can this get done?” answer, or “when is this release?” or “what’s going to be in this release?”
All those types of questions that usually some PMO and some development shop are arguing about.
So this is all really important stuff.
And I’d love… go ahead, I’m sorry.
Thinking in Probabilities Instead of Single Outcomes
Yeah, there’s one more thing I will regret if I don’t say.
The other big thing that we try to do with our app, and when we’re talking to people, is move away from there being one answer to when it will be done, and help people understand the probability of things happening in a certain range or a certain timeframe.
So, we don’t say, “It takes seven days to deliver a piece of work.”
We say, “85% of work items finish in seven days or less.”
We focus on giving people risk information so that they know not only that seven days is likely, but I mean any time between now and seven days, and it’s 85% likely.
Because when people generally get forecasts, if you don’t tell them the likelihood of that information, they’re going to fill in what they think that means.
Exactly.
One hundred percent, or whatever, and that can cause a lot of problems.
So we’re teaching people to think in probabilities instead of single outcomes.
That’s another reason why it’s really hard to forecast with a human brain and with spreadsheets.
Well, you can do spreadsheet stuff, but it is really difficult to calculate all these probabilities without a tool to help you do that.
Exactly, exactly.
And, near and dear to my heart, it’s actually your data.
So it’s not like some made-up thing. It’s actually like, “Hey, here’s what your data looks like.”
Absolutely.
And that’s what you’re already doing today.
So I love this.
A Real-World Customer Example: Wireless Logic
Can you maybe give me a real-world example where you had a customer that was able to improve that predictability, stakeholder confidence, or general delivery outcomes with the app that you guys have built?
Absolutely.
I’m going to explain Wireless Logic.
They’re a customer that we worked together with on a customer story, and we’ve got some other customer stories on our blog as well, if you want to dig into this or others.
But they experienced a problem where they were overly optimistic in their planning.
And look, that still happens to us too. Just because we have the tools to do things right doesn’t mean we always do things right.
But they had over-optimistic planning, and that planning that was saying they could get a lot more done than they really can was taking them a lot of time and effort to do.
So that goes back to originally what I was saying, is that we have these time-consuming ways of planning, and they’re still wrong, right?
We’re still not happy with the outcome.
What they were doing is that they were sitting down and trying to do time-based estimates on everything, and this team was planning in sprints.
So, a lot of times, they were planning 20 or more items per sprint, and they were always under-delivering on their expectations.
What the Data Revealed About Their Actual Capacity
So they got our app in. They were trialing it out with one or two teams.
With this one team that was planning 20 or more items a sprint, they found that they could actually, realistically, to their level of confidence, deliver about 10 in a given sprint.
So they started looking back, and they were able to say, “Well, yeah, in this sprint we finished nine. In this next sprint we finished 10.”
It was always right around what the data was really showing them.
What we try to tell people is, you don’t have to replace, you don’t have to put all your eggs in our basket and completely switch from what you’ve been doing before.
Why don’t you use your data alongside what you were doing before, so it’s a low-risk kind of thing?
Because using your data is very fast. It doesn’t take this time and effort.
Assuming you’ve got good data coming in, it doesn’t take a long time to run this alongside doing your normal time-based estimates.
But they could see that using their data gave them a much more reliable answer to how much they could do than their previous planning efforts, and they didn’t need to spend nearly as much time making that estimate.
So they pivoted.
They tried this in one team. They started rolling it out to more and more teams, and when they sort of proved it to themselves, they ended up pivoting toward what I was referring to before, which we call probabilistic forecasting.
It means understanding the different outcomes that could happen and how likely they are.
So, not only did they get better answers, but they better understood the risk associated with any of those forecasts.
Understanding the Risk Behind a Forecast
What I mean by that is, if I tell you there’s an 85% chance that you’ll finish 10 or more things in the sprint, I mean there’s a 15% chance that you’ll finish less.
So we’re really giving you a lot of risk information along with that forecast that people didn’t have before.
They had no idea how likely that 20-item thing was.
So, yeah, they saved time. They got more accuracy, which is… how do you know you made the right decision, right?
So now they’re making more achievable commitments. They’re more likely to finish that work.
Not only that, but they went from a situation where they had upwards of 20 things in progress at one time down to maybe five or six.
Stop Starting, Start Finishing
When you have less going on at one time, less work in progress, you actually lose a lot of overhead administration and status checking on everything that’s going on.
So there’s this untalked-about benefit of not only were they working on less and getting it done faster, but they also didn’t have to do all of this failure demand, this extra administration they had because they were working on too many things at once.
That really led to this cultural shift away from, you know, stop starting, start finishing, which has been a mantra in the Kanban or flow world for a long time.
They got there by discussing the age of their ongoing work and how much was in progress at one time in their daily meetings.
So, it sounds like a super easy story, and while I’m sure that it wasn’t without effort, there really are a few key things that you can do consistently, and we see these kinds of outcomes, whether they’re to this degree or not, over and over.
So we can say that it’s a good practice to do these kinds of things because we see, when many, many teams do this, when good outcomes happen, a lot of people are doing these practices to make those good outcomes happen.
Using Data Alongside Existing Agile Practices
Absolutely.
Again, I love the example there of use your data.
You don’t have to replace the way that you’re doing things, but having that data maybe gave them a perspective that they didn’t fully understand, which obviously you told us the outcomes of that.
I think that seems like it’s contrary to popular belief in the Agile community, to actually look at data and use that, not just make some estimates.
But I love the outcomes. Thank you very much.
Yeah, of course.
People in the Agile world can get really scared about data, and so you have to approach it gently.
People have to understand why you want to use it.
Are you going to punish them? Are you going to make this too scientific? I need to focus on the work.
Actually, we’re using the data so you can focus on the work.
Moving From Emotional Conversations to Solution-Focused Conversations
And I think it guides your decision-making, which is good, right?
Give me more information so that I can make a better decision.
And even the people outside of the teams that are doing that work, because they’re asking for real-world answers, to be able to give them some risk percentages about when work would be done or not done, I think is important too.
Entering that into the equation probably relieves a lot of stress at the end of the day.
Yeah, absolutely.
And you can go to someone who’s giving you an unreasonable expectation and say, “You know what? Based on how we’ve been able to perform in the past, this is what we can expect.”
So, if we want to expect something different, what do we think needs to change to be able to have a different expectation?
Using Data in Discussion
When you can take data to a discussion, it removes the… it doesn’t completely remove it, but it makes it a lot easier to pivot away from an emotional conversation to a solution-focused conversation.
That’s one of the biggest wins.
You just roll your information in there and say, “Look, I’m not saying something different can’t happen, but let’s try to figure out what we think we’re going to have to do to get that different outcome.”
Because there are lots of likely possibilities. They’re just differently likely. They’re more or less likely to happen.
So that’s when your normal conversations can happen, and you can do some scenario planning and stuff like that, and try to see, as you make these changes, is your data showing you the changes you wanted to see?
Then you can loop that learning back in and try different experiments.
I love that.
Wait, you’re not supposed to run around with your hair on fire trying to get things done? You’re actually allowed to…
Who would have thought, right? Who would have thought?
…do it a smarter way. I love it.
Run experiments and check the outcomes.
Exactly.
And have some risk understanding. I think that’s another valuable outcome out of that too.
That’s great.
Closing Thoughts
Julia, thank you for your time and for joining me and for sharing your perspective and your successes. I appreciate your time.
Of course. Thank you for having me.
So, if your organization is struggling with these types of unpredictable delivery dates or bottlenecks, or trying to understand where things are, or even giving stakeholders confidence on when work is going to be completed, our team at SPK, and obviously the team at 55 Degrees, can actually help.
If you found this discussion useful, please subscribe to the SPK & Associates YouTube channel for more.
We’ll talk about a bunch of different things, but usually it’s around product, Agile, Atlassian, DevOps, AI, and the way to help deliver products to the market more quickly.
So thanks for your time, and we’ll see you next time.