
In my previous entitled “Metrics, Metrics, Metrics in PTC Integrity: Part 1” I introduced the out of the box traceability metrics that come with PTC Integrity, and talked a little bit about how they work. In this article I will build on that by showing how you can leverage those metrics to build a simple report to demonstrate the traceability coverage in your active projects. The report we are going to build is a simple back trace report as follows:
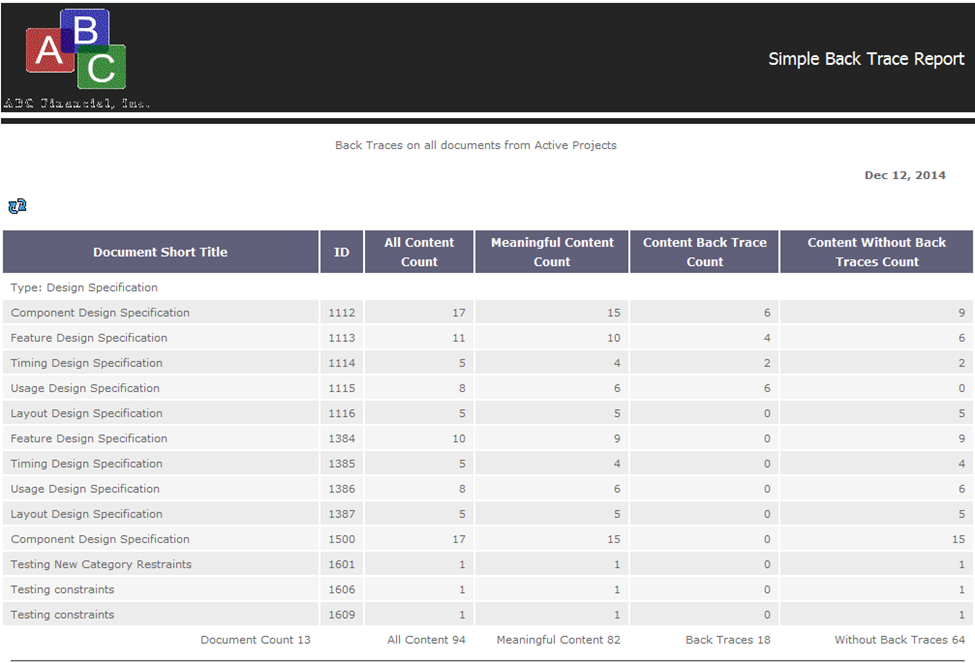
This report performs the following activites:
- It performs a query on the database to retrieve all of the document items in the database.
- It groups those results by Item type.
- Then it provides totals for each group of documents. Above we can see 13 Design Specification documents, as well as totals for all of the various content metrics.
Next I will take you step by step through the process of building this report using the PTC Integrity Report wizard. Perform the following steps to build this report:
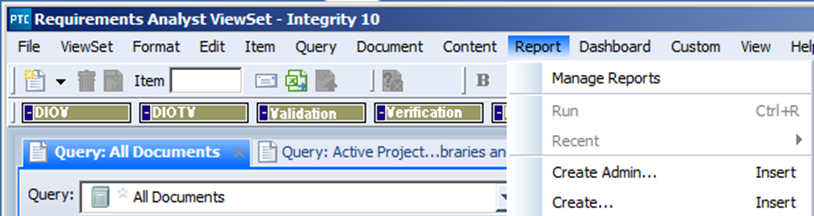
- From the Report menu in your PTC Integrity, select “Create…” If the Report menu or the “Create…” option does not exist, you may have to customize your ViewSet to make it visible. The “Create Admin…” option should only be used if you are a member of the Administrator group, and you are looking to build a system supported report for use across your entire PTC Integrity instance. In this case I just want to build a report for myself, and maybe a friend.
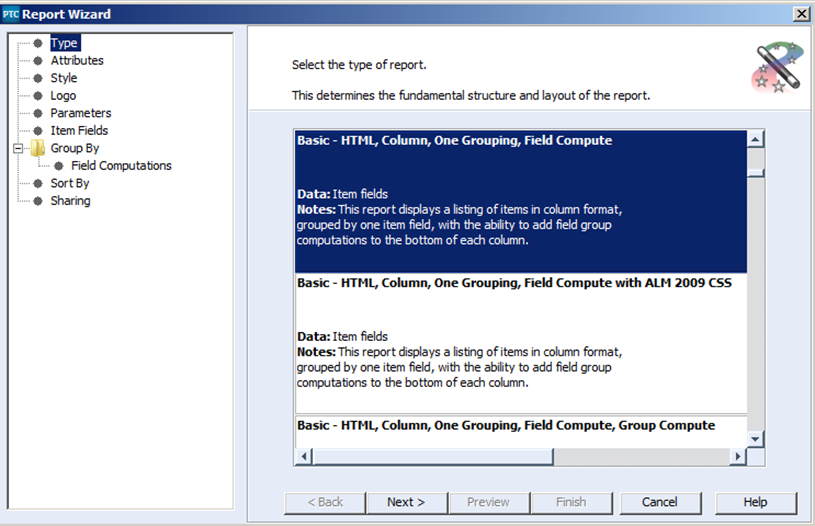
- This will open the PTC Integrity Report Wizard. The first thing you do when you are creating a new report is to select the type of report you want to produce. These types are called Report Recipes. In this case we select the “Basic – HTML, Column, One Grouping, Field Compute”
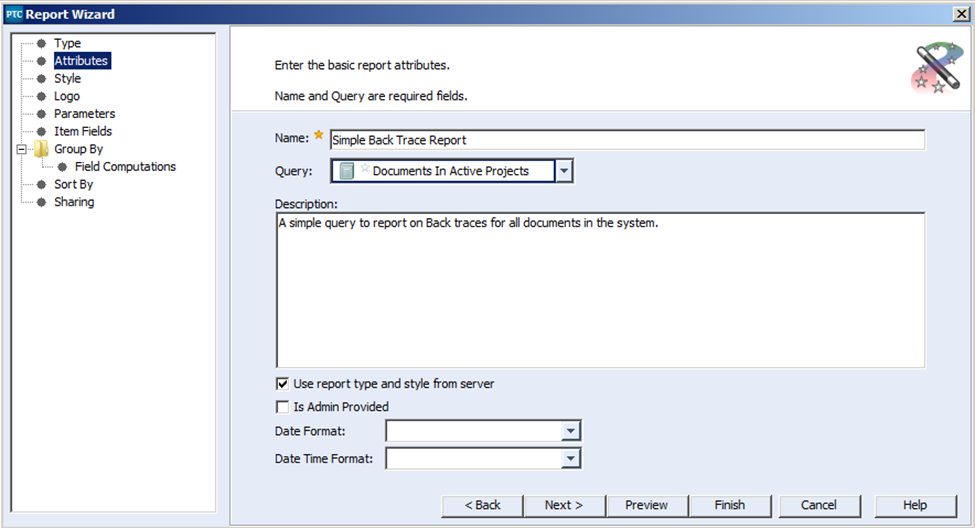
- After selecting the “Next >” button we fill in attributes like a Name for the Report, the query you want to base your report on. In this case we use the Admin provided query: “Documents In Active Projects,” and a simple description. In this case the report we are creating is for our own use, so the “Is Admin Provided” check box we’ll leave alone. (This option is only active when you belong to the administrator group.)
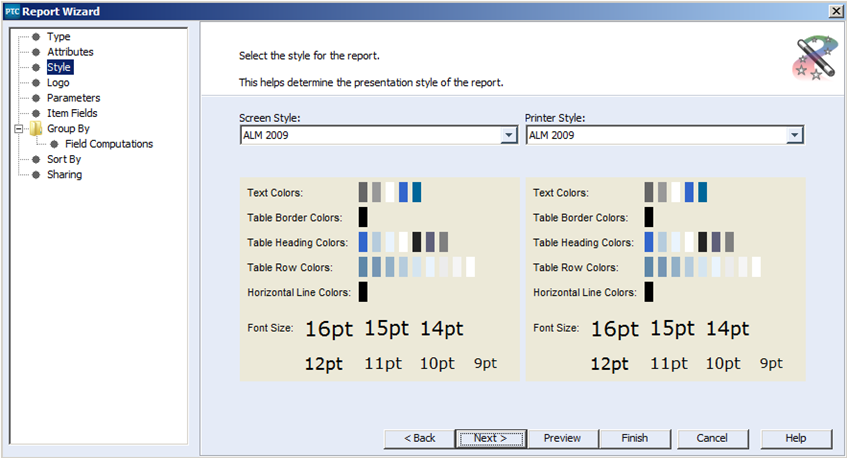
- On the Next panel, you select the style that can be applied to the HTML report. There are several basic styles available for your convenience. In this case I selected ALM 2009 for both the screen display and when the report is printed out.
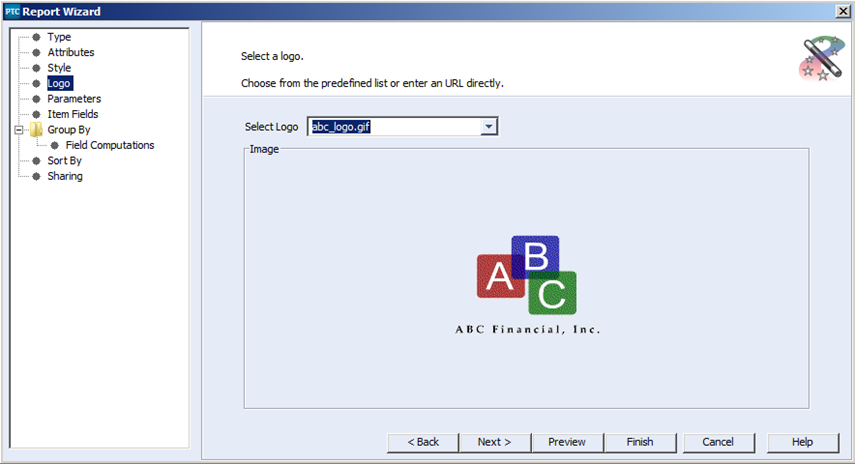
- In the next panel, you can select an image already stored on your server as a logo for your report.
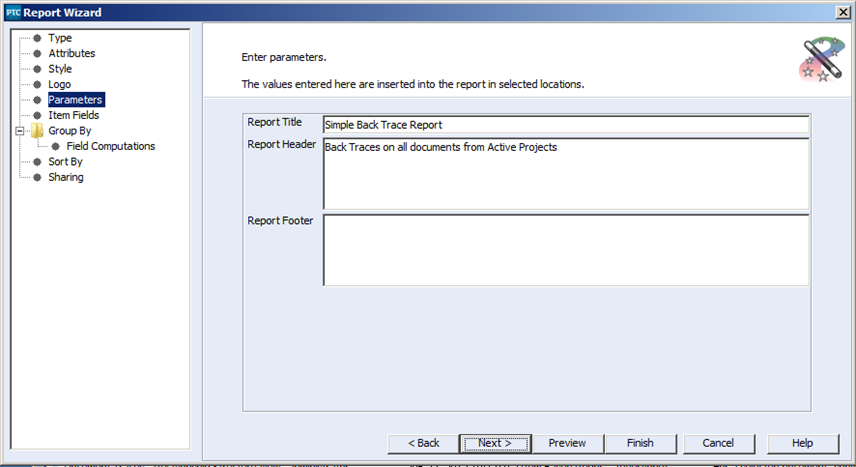
- Next you can set up a title, a header and a footer that will be displayed on your report as follows:
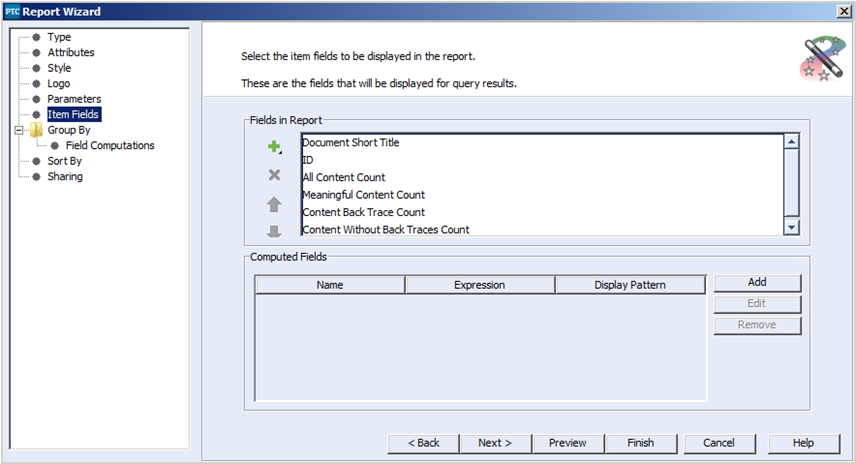
- After that, we select the fields that we included in the report above.
- The group by option will group all results returned from the query by the values of the field specified in the Group By field. In our case we are going to group the results by the Type field.
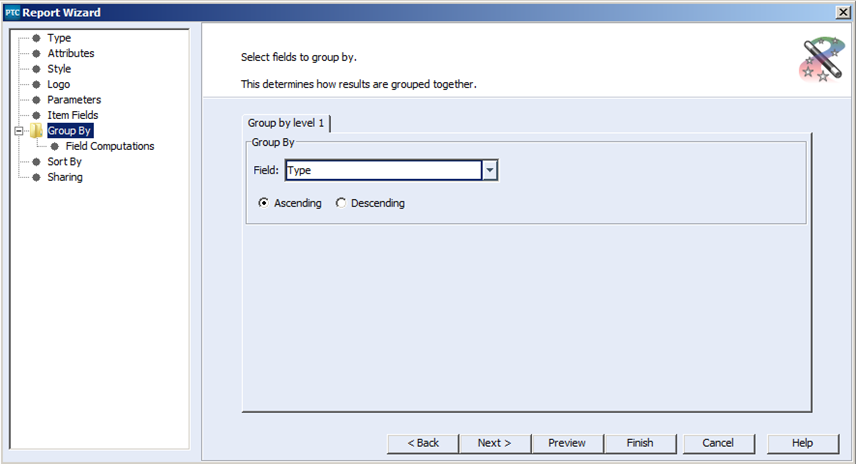 Since the query we specified will only be returning items of that are documents, the values for Type will be restricted to values such as “Design Specification”, “Requirements Specification” and “User Needs”. That means that the report will be broken up such that all returned “Design Specifications” will be together, all “Requirement Specifications” will be together and all “User Needs” will be together.
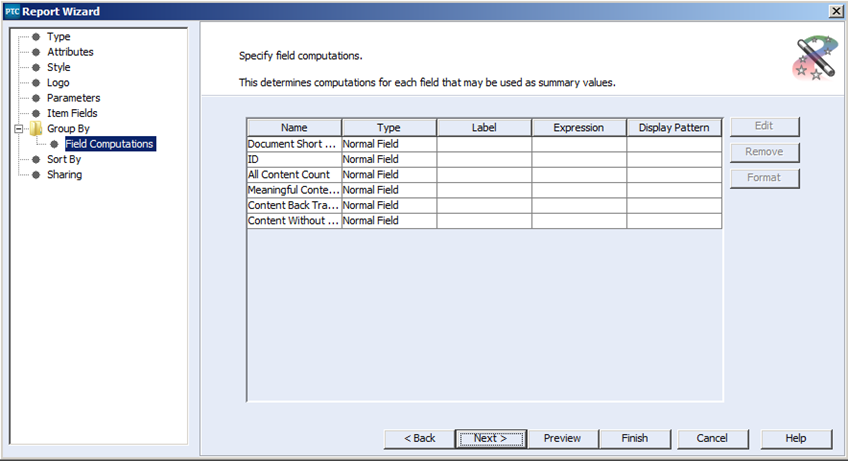
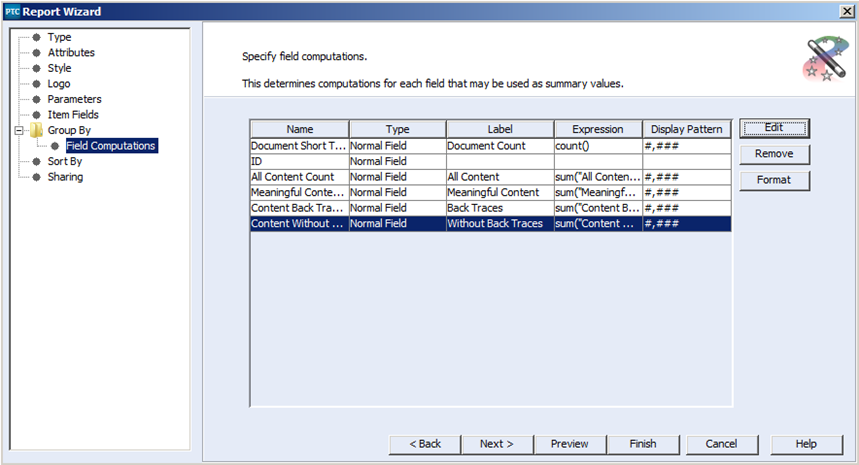
 - On the next panel, we have the option of performing computations on the columns of data within each grouping.
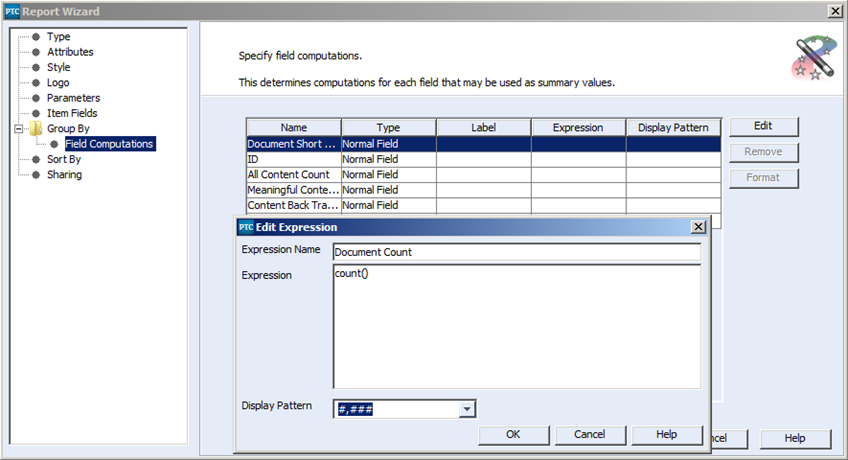
- For the first computation, we will simply count all of the “Document Short Titles”. To do this we first select the line with Document Short Title, and then select the edit button. This will open the Edit Expression dialog, where we can name the expression, set up the computation, and set a display pattern for the resulting integer.
- For the next computation, we want to add up all of the integers in the All Content Count column. In this case we will use the “sum()” function to add up all the values in the named field.
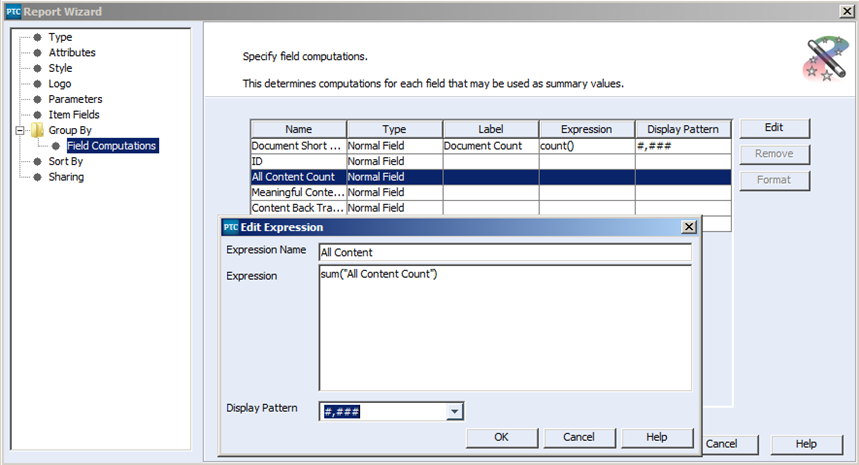
- Similarly we will use the sum function to create totals for each of the columns, “Meaningful Content Count,” “Content Back Trace Count” and “Content Without Back Traces Count.”
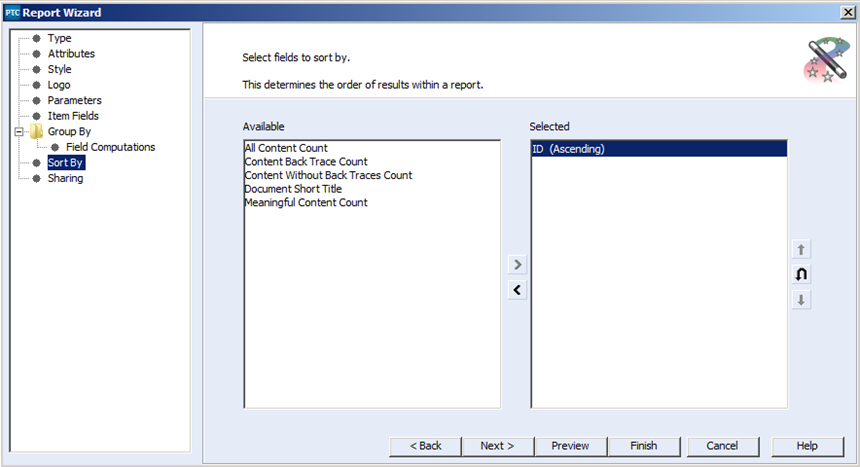
- Next comes the Sort By panel. Since this report is grouping the major items together already, sorting is probably less important. In this case I simply sorted the items by their IDs.
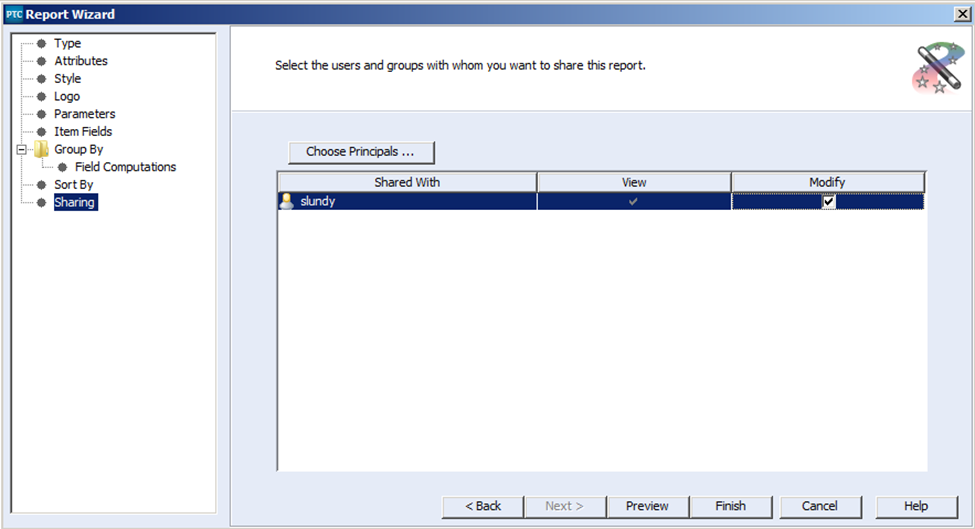
- The final panel is the Report Sharing panel. Using the Choose Principals button you can elect to share your new report with specific individuals and/or groups through-out your organization. You can even delegate to individuals permissions to make changes to the report. In this case I simply shared the report with myself alone.
This report was just one example of what you can do with the reporting that comes with PTC Integrity. In this case, I believe the ability to report on what has been properly traced in PTC Integrity will go a long way in determining whether or not you are ready to deliver whatever product you are using PTC Integrity to deliver.
In my next blog article, I will describe how to build a chart with PTC Integrity as opposed to a report.
Next Steps:
- Read the other articles in my “Metrics, Metrics, Metrics in PTC Integrity” series:
- Contact SPK and Associates to see how we can help your organization with our ALM, PLM, and Engineering Tools Support services.
- Read our White Papers & Case Studies for examples of how SPK leverages technology to advance engineering and business for our clients.